Eigentlich wollte ich Python besser zu lernen und Jupyter Notebook dafür nutzen. Die vorbereitete .ipynb Datei wird automatisch in die Quarto-Website eingebunden. Nice!
Random Code
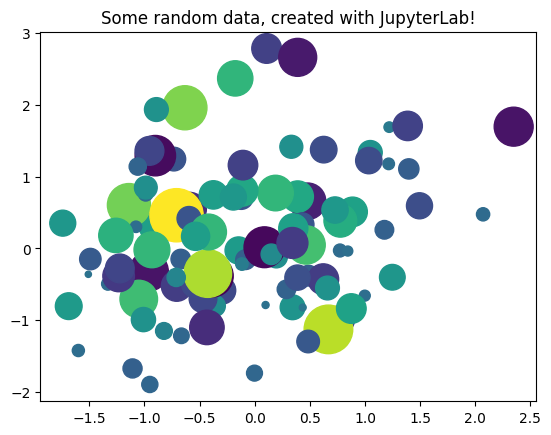
from matplotlib import pyplot as pltimport numpy as np# Generate 100 random data points along 3 dimensionsx, y, scale = np.random.randn(3, 100)fig, ax = plt.subplots()# Map each onto a scatterplot we'll create with Matplotlibax.scatter(x=x, y=y, c=scale, s=np.abs(scale)*500)ax.set(title="Some random data, created with JupyterLab!")plt.show()
Ich werde aber noch Python und Quarto in R Studio ausprobieren und danach entscheiden, welche Variante für mich besser geeignet ist. On va voir…